VAST 2021 Mini Challenge 2
Solving the mystery behind the disappearance of employees by visualizing employee data.
Created Using: HTML CSS D3.js Python
This project was our solution to the VAST 2021 Mini Challenge 2. A live demo of this project can be found here! The code for this project is available at: github.com/HitanshShah/vast-2021-mini-challenge-2. Reach out to me via email if you have any queries related to this project.
This challenge is about the disappearance of certain employees of a natural gas production company, GASTech, right before its initial public offering. We have been provided with the following data and the main objective is to visualize this data, observe trends, patterns, or anomalies in the behavior of these employees and understand who was behind the kidnapping of employees:
- GPS tracking data of each vehicle
- Vehicle to employee mapping
- Credit card and Loyalty card transaction information
- ESRI shapefiles of Abila and Kronos, the city of this company
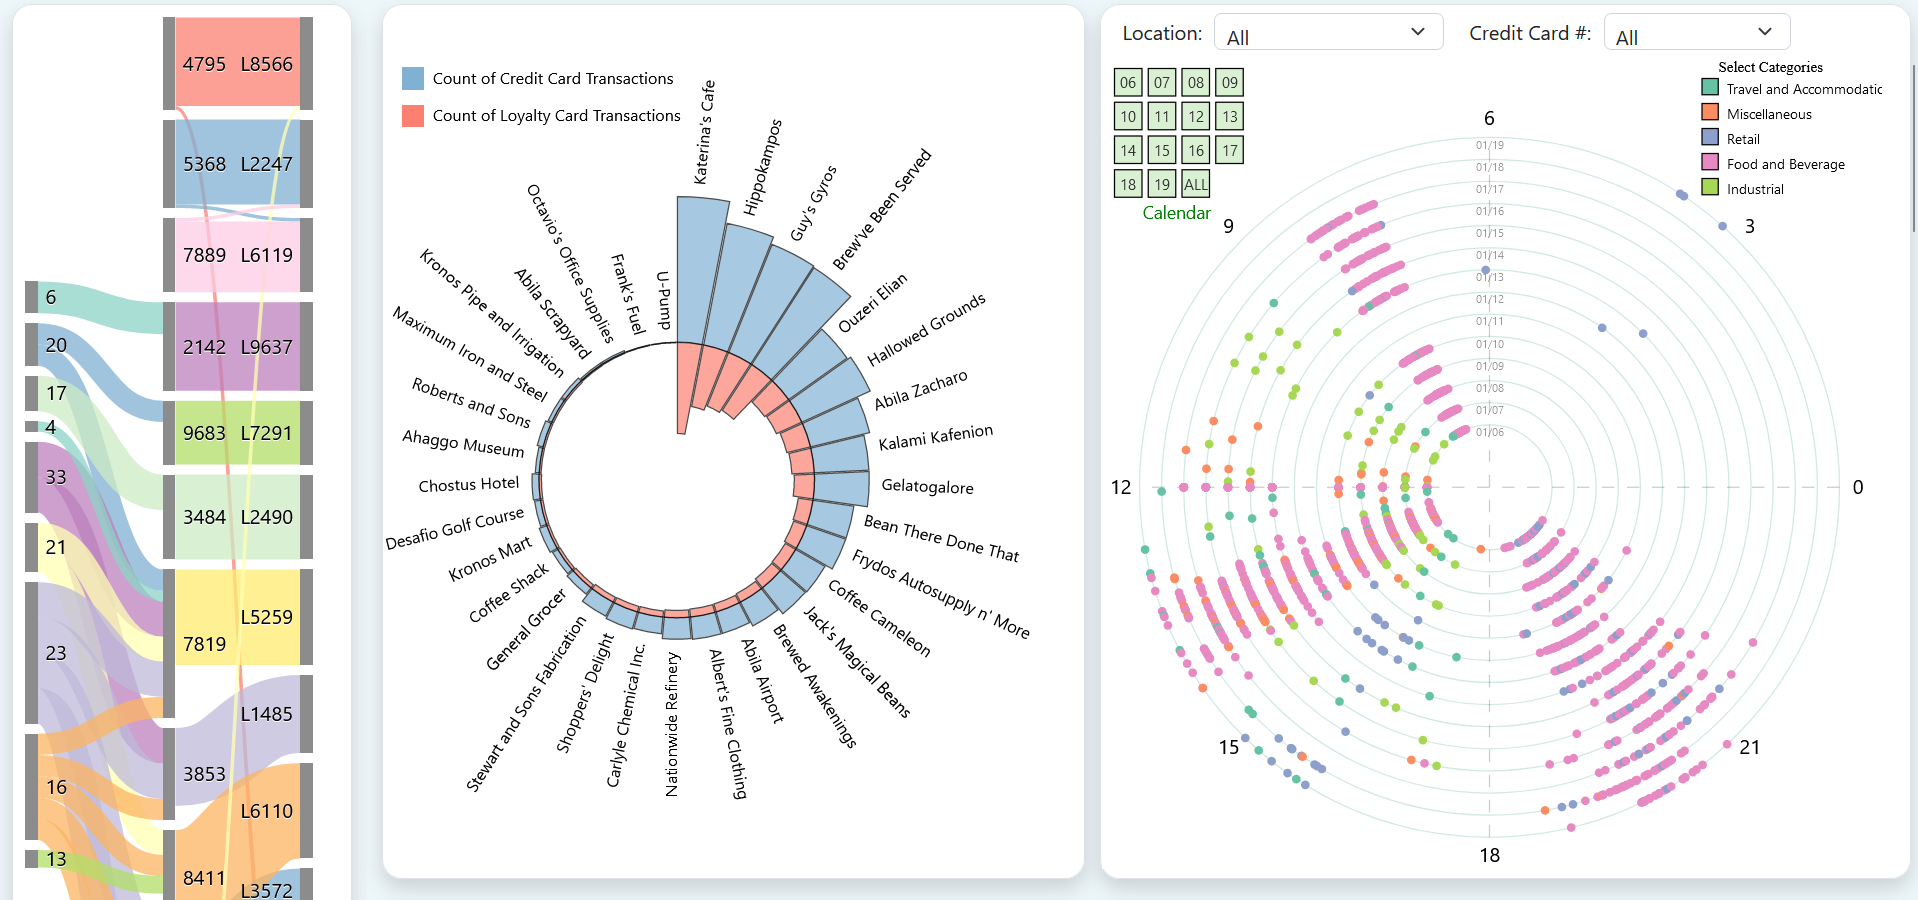
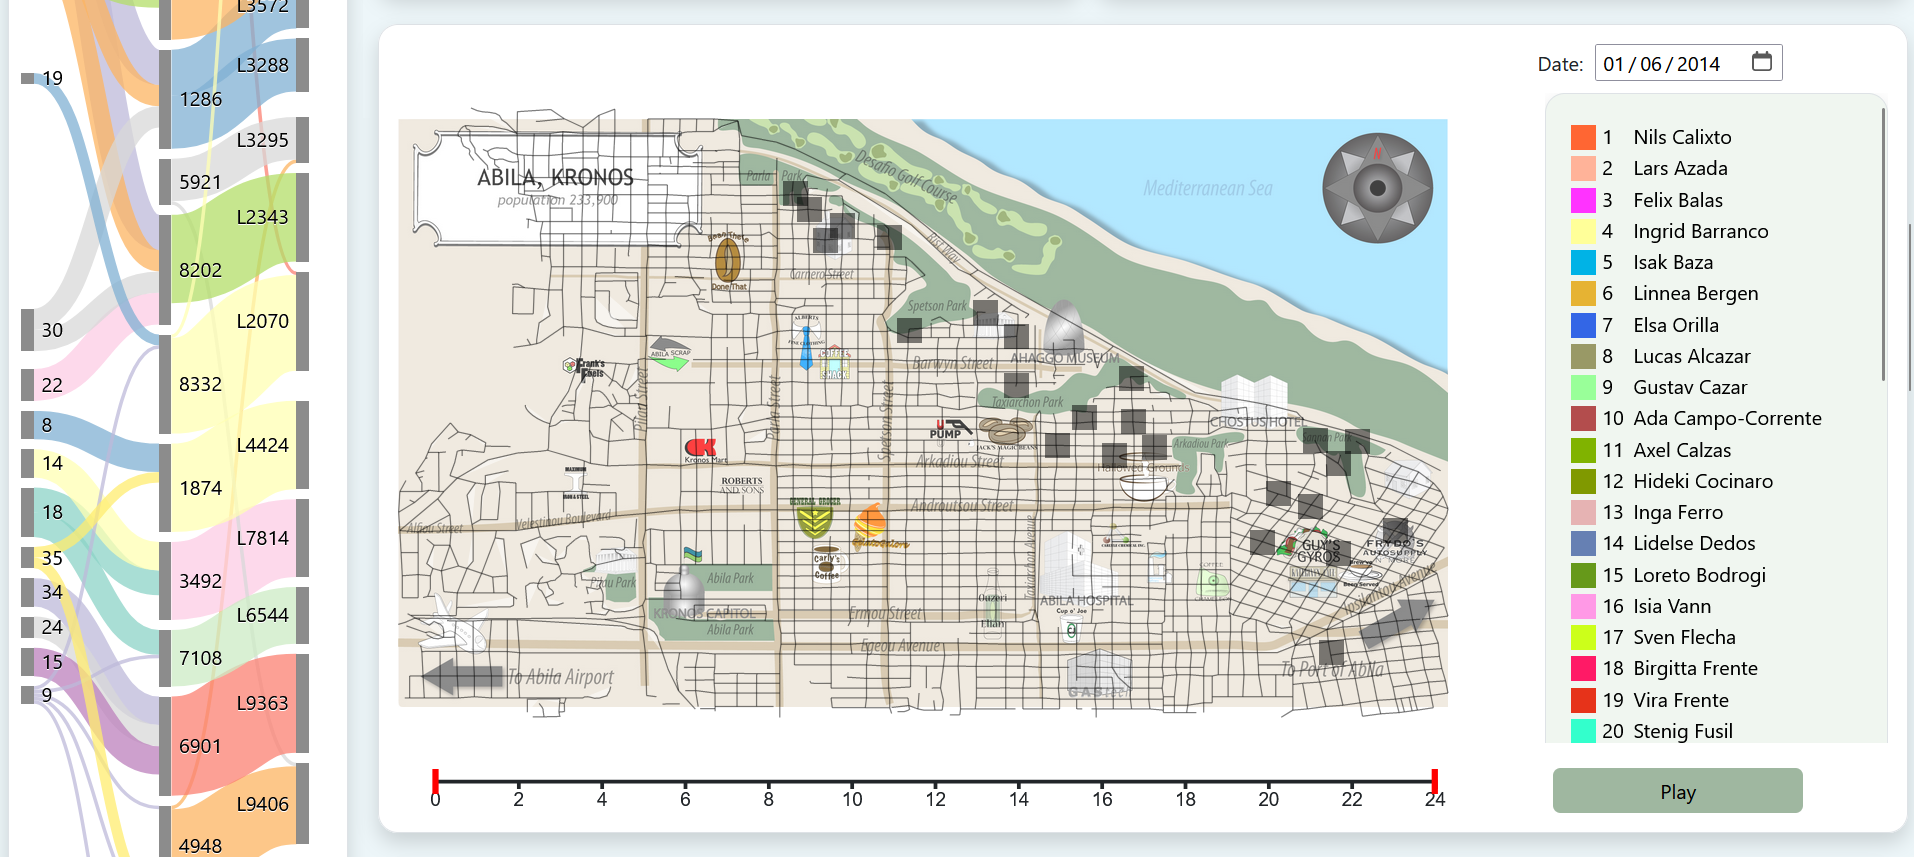
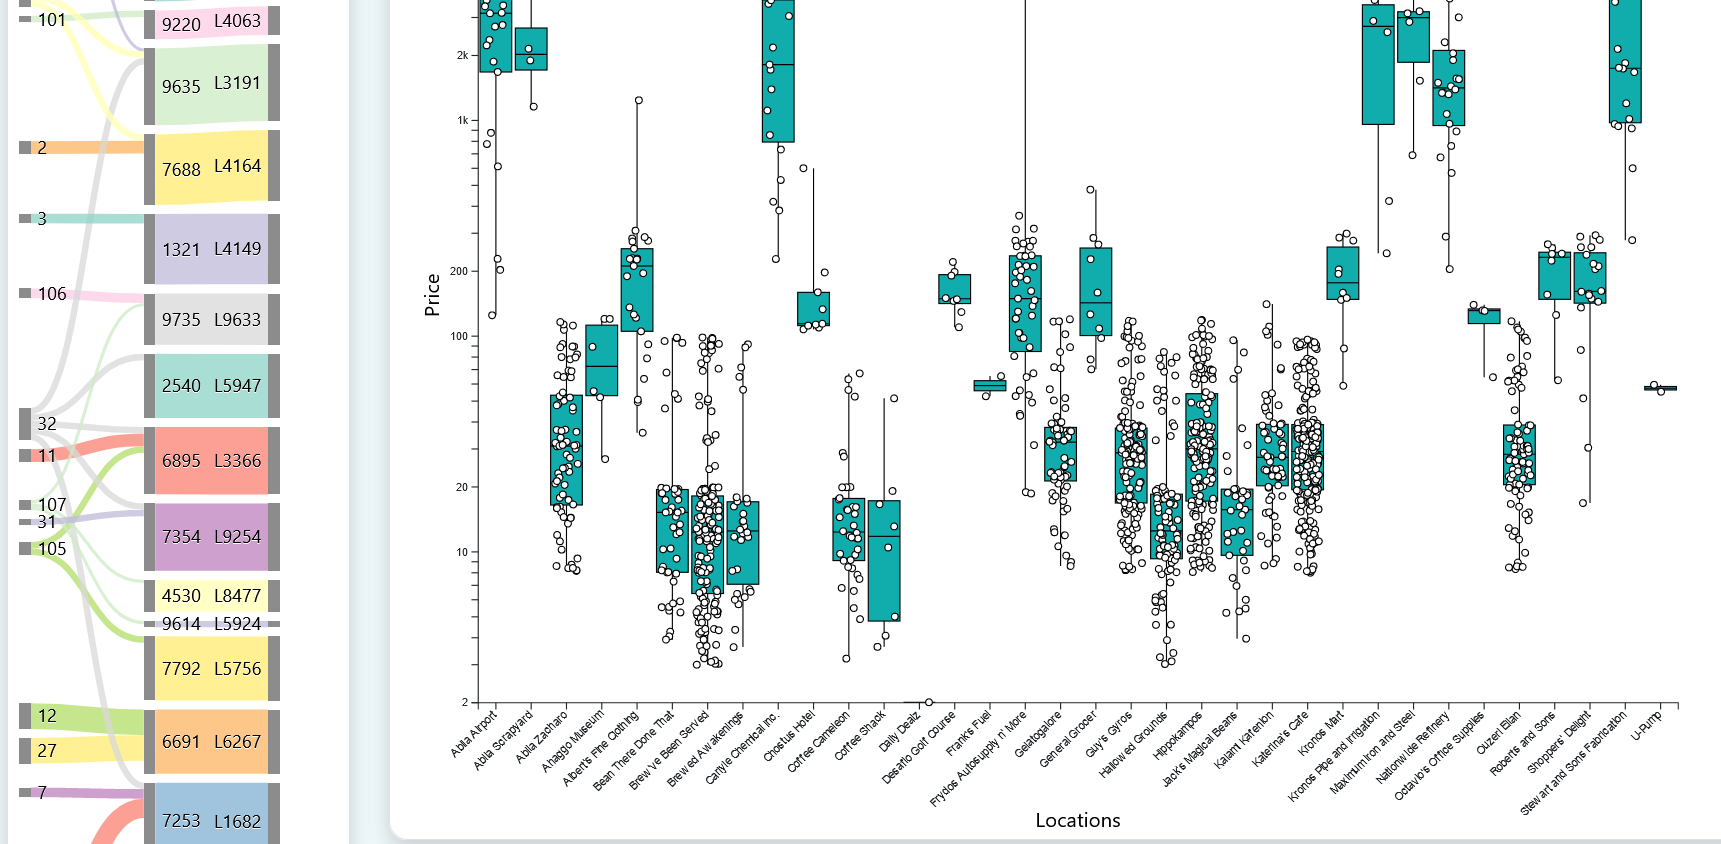
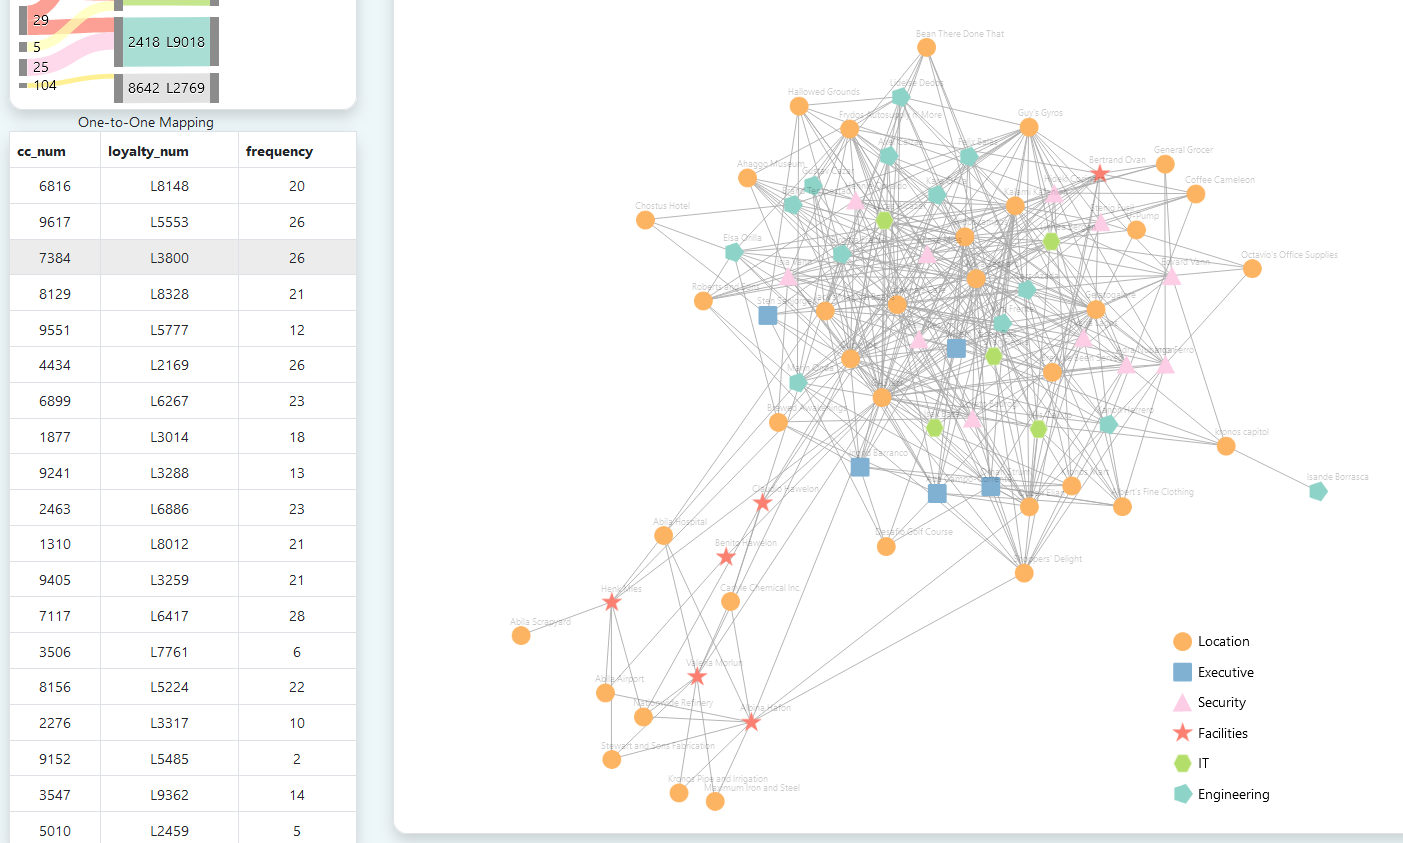
To visualize this data, we created the following visualizations:


Please watch the following short video in which I demonstrate the working and functionalities of the overall solution: